My fascination with Nixie tubes began around 2006. These beautiful retro tubes make amazing displays and have been made into hundreds of well documented clocks. At that time I bought a handful of tubes and got permission to build a Nixie clock as project for a senior level undergrad EE lab course. I actually built it as two separate boards, a serially addressed Nixie display and a serial output clock module.
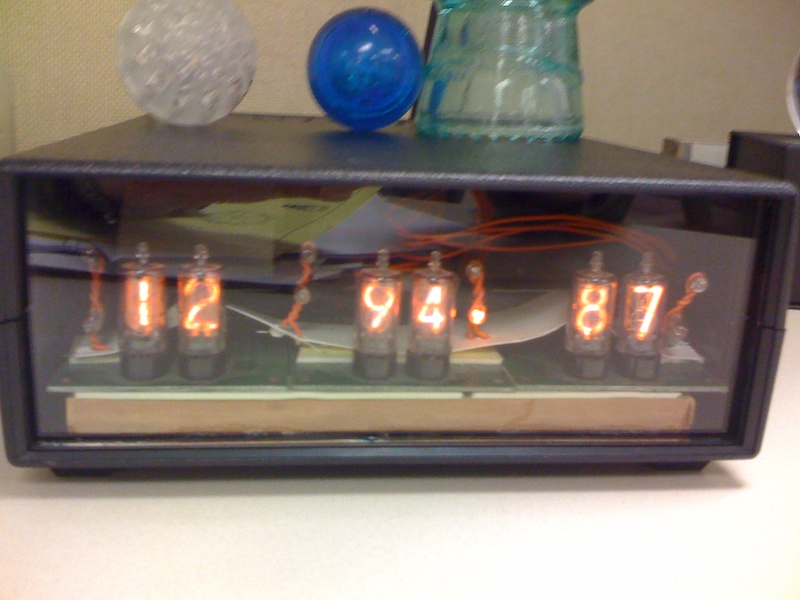
Both the display and the clock were built around an AT89C4051 microcontroller, with direct drive using one K155ID1 per chip. The high voltage supply was a switch mode module from LEDSales (I have since moved on and all my more recent projects use the Taylor Edge 1364). The tubes themselves were Burroughs B5750s, which I got on pre-made break out cards with edge connectors, two tubes to a card.
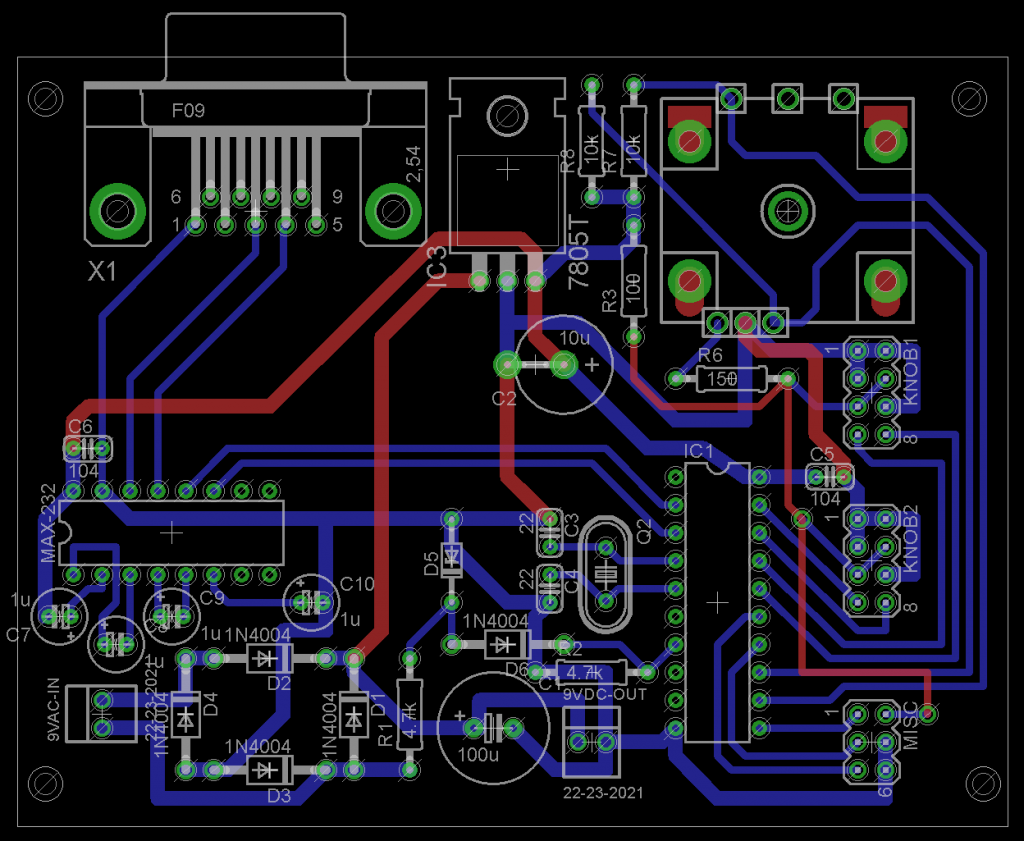
The clock module also used an AT89C4051. The very simple timekeeping circuit took an AC input through a voltage divider and zener clamp and counted pulses. This is actually a surprisingly stable way of keeping time, as at least in the US, electric utilities will actually slow down or speed up frequency slightly overnight to make up for irregularities during the day. This means that while line frequency clocks are worse than cheap quartz clocks hour to hour, they are actually generally more accurate month-to-month.
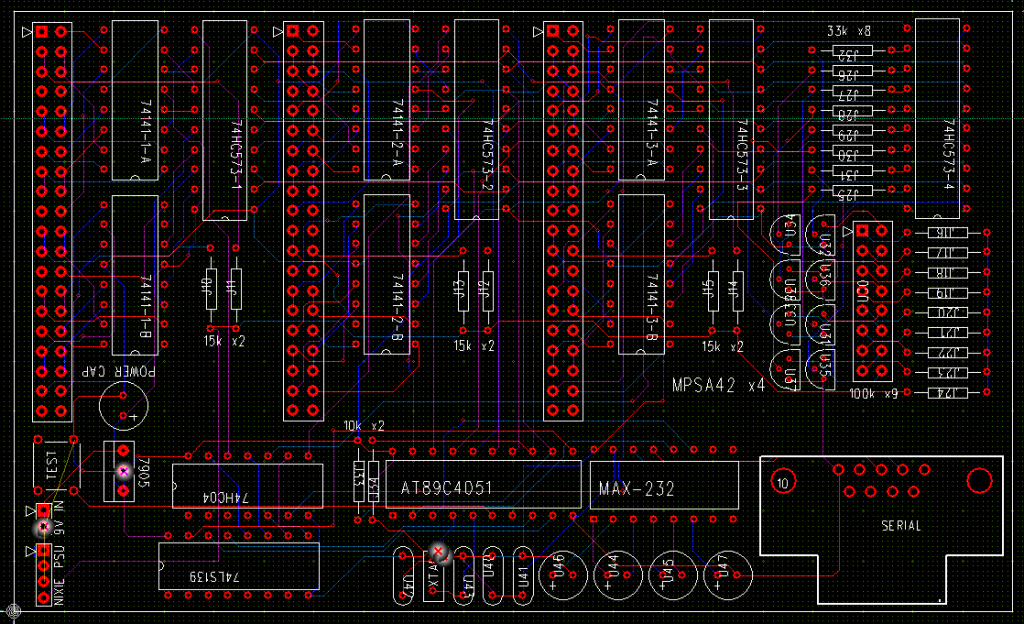
For the display board, I didn’t have a saved copy of the routed PCB, and as it was one of the first boards I ever laid out, it wouldn’t have been good anyway, so I just re-downloaded PCB123 (again, I was a ‘young player’ as Dave Jones would say) and ran the autorouter to give you the just of the board. Each 40-pin header drove a dual Nixie card (god, the inefficiency!)
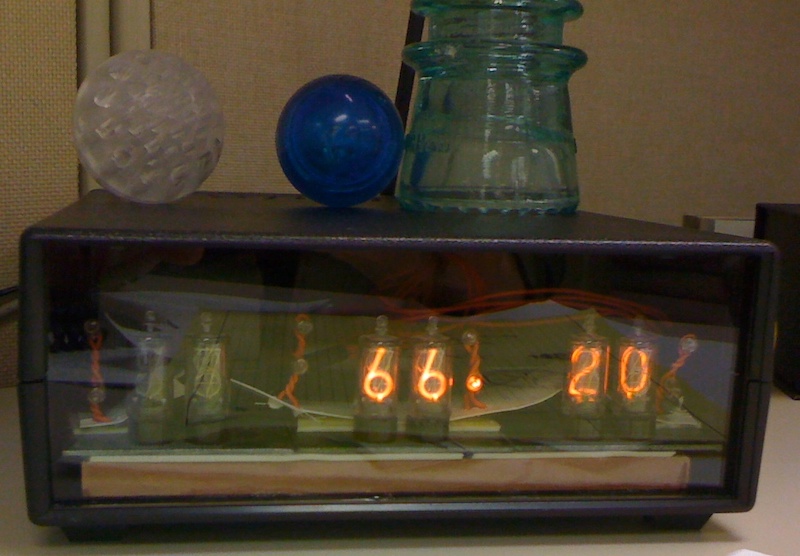
I was never really happy with the clock design, from a user perspective, so it got put away pretty quickly. The display module, on the other hand was really satisfying. It ended up at my first full time job. Because I worked at the local power company, and had access to real-time SCADA data for the grid, it was used to display the power consumption of the city we were in (in MW).
The code ran in Python and used a command line utility to extract the various datapoints, which it then drove to the display, updating every five seconds or so. The final version would rotate between showing power consumption for two cities that we served, and the temperature (˚F) in each of those places.
It definitely got a few looks over the years that I had it running, and I still have the display in a box somewhere, but I’ve moved on career wise, so I don’t have the cool data to display in real time anymore.
Oh well, not much of a story, but I thought I might as well document it and share.